|
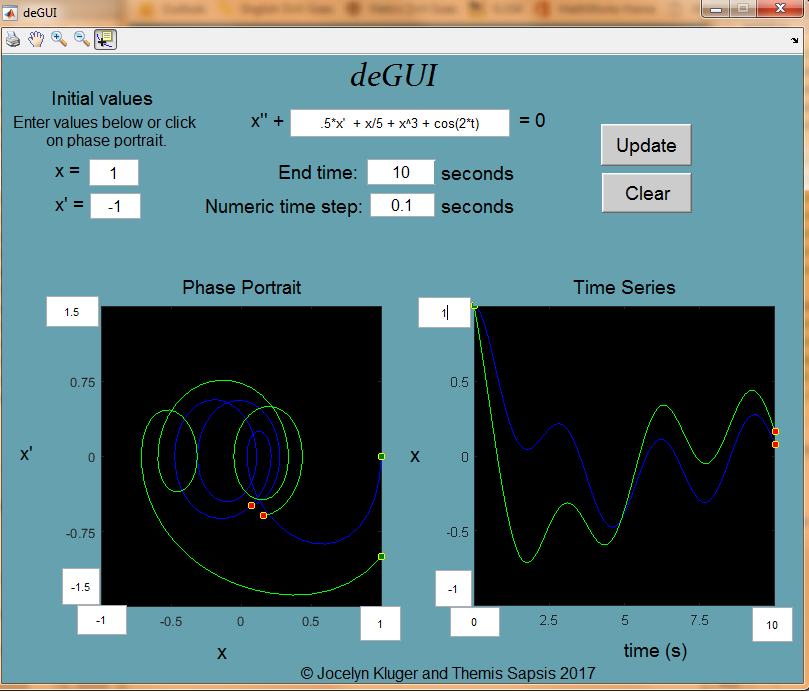
| Screenshot from the deGUI App. |
This application allows you to visualize the behavior of nonlinear systems by plotting time series and phase portraits. You specify a second order nonlinear differential equation in the equation textbox. Specify the simulation End time and Numeric time step. Then specify x and x' initial conditions by entering values in the textboxes or clicking on the phase portrait.
Use the toolbar icons to zoom in, zoom out, and pan the plots. Select the 'print' icon to print the results to MATLAB figures.
I welcome any questions, comments, or suggestions about this app. Please email me at jociek@alum.mit.edu.
Getting Started
If you have MATLAB R2015a or newer, download this zip file, which contains deGUI.m and deGUI.fig. Run deGUI.m to launch the app.
If you do not have MATLAB, download this executable file. The installation process will download the 0.5 GB program MATLAB Runtime, which is required by deGUI to run without MATLAB. Double-click on the program icon to launch the app.